
This personal project was primarily made for fun in 2018.
It also served to experiment how to draw charts with Java using JFreeChart, how to use JSON resources (using Gson library) and how to consume an API with a GET request (using Apache HttpClient library).
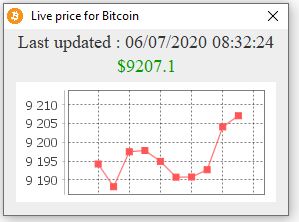
The program displays a small window in a pop-up style with the current bitcoin price. The price is updated every minute and a chart will draw itself remembering the last 10 retrieved prices. Then every new update will delete the oldest stored price.
If the new updated price is higher than the previous one, the price will turn green, if it is lower, it will turn red, and if it stays the same the price stays (or turns) black. You can also zoom-in and out the chart with the scroll wheel or by selecting an area on the chart.
Skills :
- using HttpClient library to make a HTTP request
- consume a free API from an outside provider
- draw a dynamic chart with JFreeChart
- work with JSON data with the Gson library
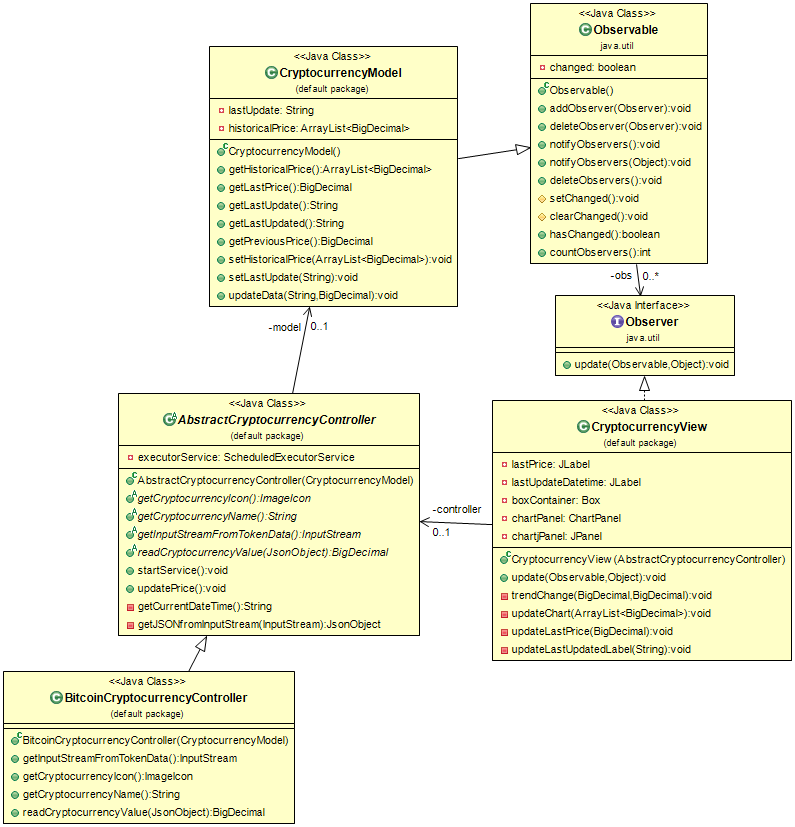
- using a MVC architecture with controllers, models and view
Architecture:
The design is open for extension if we want to add a new cryptocurrency by implementing AbstractCryptocurrencyController class. The default and unique current implementation is for Bitcoin.
Screenshots :
Click here to see the source code or download the executable file…